
Key facts
- Iowa has 15,309 animal feeding operations — thousands more than state regulators track.
- The top 5 Iowa counties hold nearly 20% of all livestock facilities, creating localized demand hotspots for feed delivery.
- Manure is 'expensive and difficult to transport long distances' — feed faces identical transport constraints limiting delivery zones.
- 29% of Iowa facilities are large operations (1,000+ animal units) generating 60% of regional manure activity — yet delivery zones often ignore smaller farms creating underserved gaps.
- Farmers abandon carts and waste hours on phone calls when delivery zones are buried — competitors win by showing boundaries upfront before the question is asked.
- Geospatial mapping using satellite imagery + road networks identifies every livestock facility within a feed supplier's drive-time radius — automating precise delivery zones without manual work.
- Feed suppliers lose margin on every mile — unclear delivery zones force wasted quotes for unreachable addresses and abandoned orders from farmers who assume they're outside service areas.
WANT RESULTS LIKE THIS?
Imagine a system doing all of this for your local business — every day, without you.
We build local businesses a custom website with a team of AI behind it: every lead captured and followed up, new content published monthly,customers finding you on Google — live in 7 days.
- 85+ pages at launch
- Every lead followed up, automatically
- Your whole business on one screen
The Hidden Cost of Unclear Delivery Zones
When a farmer visits a feed supplier's website, they need one answer first: can you deliver to my operation? Yet across the industry, that answer is buried — if it exists at all. The result isn't just frustration; it's abandoned carts, wasted phone calls, and farmers turning to competitors who make delivery boundaries obvious.
The scale of the challenge is hidden in plain sight. Satellite mapping by the Environmental Working Group identified 15,309 animal feeding operations in Iowa alone — several thousand more than state regulators track. Those operations aren't evenly distributed: the top five counties hold nearly 20% of all facilities, creating intense, localized demand that feed suppliers must serve efficiently. Meanwhile, global livestock distribution data exists at a macro level, but it's built for policy — not for a farmer trying to place a Tuesday order.
- Farmers can't self-qualify — they call or fill forms for addresses you'll never serve
- Sales teams waste hours quoting deliveries outside viable radius
- Minimum-order thresholds by zone stay invisible until checkout
- Delivery schedules (Monday/Thursday, weekly, biweekly) go unpublished
The economics are unforgiving. As EWG's Anne Schechinger notes, manure is "expensive and difficult to transport long distances" — and feed faces the exact same physics. Every mile erodes margin. When delivery zones stay vague, you pay twice: once in lost customers who assume you don't serve them, and again in wasted quotes for addresses you can't profitably reach.
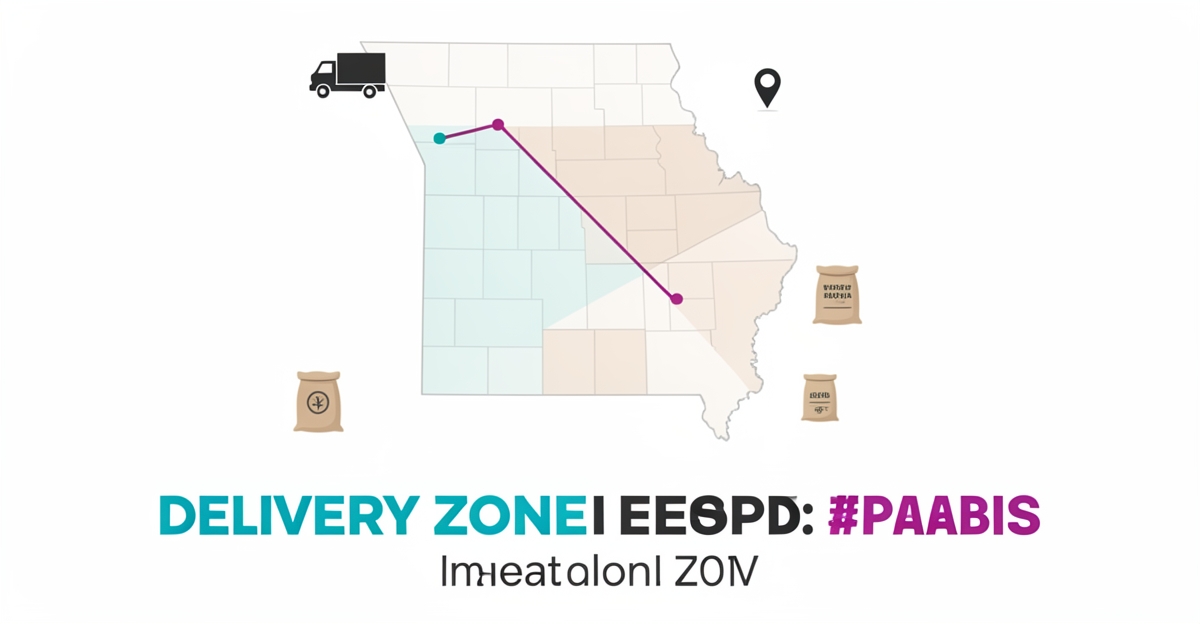
AI Business Sites solves this by turning operational reality into customer clarity. The platform automatically maps delivery zones based on farm locations and road networks, generating service-area pages that show farmers exactly where and when deliveries run — down to the county, zip code, or drive-time radius. No manual mapping. No outdated PDFs. Just a website that answers the first question every farmer asks.
Geospatial Solution: Automated Delivery Zone Mapping
The same satellite imagery that revealed 15,309 animal feeding operations in Iowa — several thousand more than state regulators track — can now map exactly where feed trucks can and cannot reach. Environmental Working Group analysts used USDA aerial imagery and road networks to pinpoint every facility, proving that geospatial analysis works at the scale feed suppliers operate. That methodology, applied to delivery logistics instead of regulatory compliance, turns vague "call for availability" promises into precise, farm-level zone maps.
- Satellite imagery identifies every livestock facility within a supplier's practical drive-time radius
- Road network analysis calculates actual delivery routes, not straight-line distances
- Facility density data reveals where minimum-order thresholds make economic sense
- Automated updates keep zones current as new operations appear or roads change
The economics mirror what researchers already documented: manure is "expensive and difficult to transport long distances", creating natural service boundaries around supply points. Feed faces identical constraints. When the top five Iowa counties concentrate nearly 20% of all facilities, a supplier's delivery zones aren't arbitrary — they're dictated by physics and fuel costs. AI Business Sites applies this same geospatial logic to automatically generate delivery zone maps for feed suppliers, then builds location pages that show farmers exactly where they stand. The result: a website that answers "do you deliver to my farm?" before the question is asked.
Local business: doing this the old way?
One system replaces the whole pile.
All of it — the website, the follow-up, the content, the leads — built and run for you for $1,497 + $497/mo. Month-to-month, and you own everything.
See what your build includesImplementation Strategy for Feed Suppliers
Livestock feed suppliers can transform unclear delivery information into a competitive advantage by implementing precise, transparent delivery zone mapping on their websites. Start by analyzing your customer base to identify high-concentration farming areas—research shows the top 5 Iowa counties alone contain nearly 20% of all livestock facilities, creating natural logistics hotspots where delivery clarity matters most. EWG's satellite imagery methodology proves geospatial mapping is technically feasible; adapt this approach using your supplier locations, road networks, and drive-time analysis to generate accurate delivery boundaries.
Prioritize these high-density regions first, as transport economics make feed—like manure—expensive and difficult to move long distances, naturally limiting service areas. 29% of Iowa facilities are large operations (1,000+ animal units) generating 60% of regional activity, but don't overlook smaller farms; the regulatory tracking gap revealed "several thousand more" operations than state databases show, representing an underserved segment. Create dedicated location pages for each zone that clearly communicate delivery radius, minimum order requirements, frequency schedules, and any surcharge tiers—turning logistical constraints into transparent customer expectations.
Finally, integrate this mapping directly into your website's service area strategy. AI Business Sites' platform automates this process by mapping delivery zones based on farm locations and road networks, ensuring farmers see exactly where and when deliveries are possible. This eliminates guesswork, reduces inquiry volume, and builds trust by making your service boundaries visible and understandable—directly addressing the confusion that causes lost sales when farmers can't quickly determine if they're within your delivery range. By focusing implementation on verified livestock concentrations and communicating logistics transparently, feed suppliers convert delivery zone clarity into measurable customer confidence and conversion improvements.
Frequently Asked Questions
How do I know if a feed supplier actually delivers to my farm?
Why are delivery zones so strict for livestock feed?
Can you really map delivery zones automatically without manual entry?
Will a delivery map help me find more customers in high-density areas?
Do these maps only work for the biggest industrial farms?
What information should be on a delivery zone page besides a map?
Turn Delivery Zone Confusion Into Your Competitive Edge
For feed suppliers, every customer who lands on your website with a cart half-filled is a potential sale slipping away—not because your feed isn’t the right choice, but because the first question on their mind—*can you deliver to my farm?*—goes unanswered until it’s too late. When delivery zones are buried in PDFs or hidden behind a vague "call for availability," farmers move on to competitors who make logistics visible from the start. The cost isn’t just in abandoned orders; it’s in wasted sales calls, frustrated customers, and missed opportunities in some of the most concentrated livestock regions in the country. With AI Business Sites, you’re not just updating your website—you’re turning operational reality into customer clarity. The platform automatically maps your delivery zones using real farm locations and road networks, so farmers see exactly where and when deliveries are possible before they pick up the phone. That means fewer lost leads, no more guessing about service areas, and a website that works as hard for your sales team as your trucks work for your customers. Ready to stop losing customers to unclear delivery info? Start by making your service boundaries as transparent as your feed quality.
FOR local businesss — BUILT AND RUN BY US
Your website. Your content. Your leads. Your data.
$500 starts your build. Seven days later it's live — chat, booking, follow-up, and your Google presence all set up. Then we run it, every month. You do the work you actually get paid for.