
Key facts
- Advanced GIS platforms integrating satellite, drone, and drill data deliver 30–40% improvements in discovery rates across major gold districts according to Farmonaut case studies
- Nevada Goldfields achieved a 30% gain in mapping accuracy and a 2.3 million ounce resource estimate using multi-source GIS integration per Farmonaut research
- Over 75% of new gold sites in 2025 are expected to be identified using advanced GIS mapping technologies Farmonaut projects
- A peer-reviewed study mapped 65,585 km² of global mining footprint, finding nearly 10% falls within protected areas Mongabay reports
- BlackRock warns investor reluctance may reduce miners' access to capital and delay the energy transition Worley notes
- Specialized firms like Darling Geomatics create precise digital twins of underground mines and infrastructure using 3D scanning and UAVs Darling Geomatics details
- Nick Bell of Worley states the industry has not won the hearts and minds of the public or investors Worley insights reveal
WANT RESULTS LIKE THIS?
Imagine a system doing all of this for your local business — every day, without you.
We build local businesses a custom website with a team of AI behind it: every lead captured and followed up, new content published monthly,customers finding you on Google — live in 7 days.
- 85+ pages at launch
- Every lead followed up, automatically
- Your whole business on one screen
The Credibility Gap: What Basic Maps Fail to Communicate
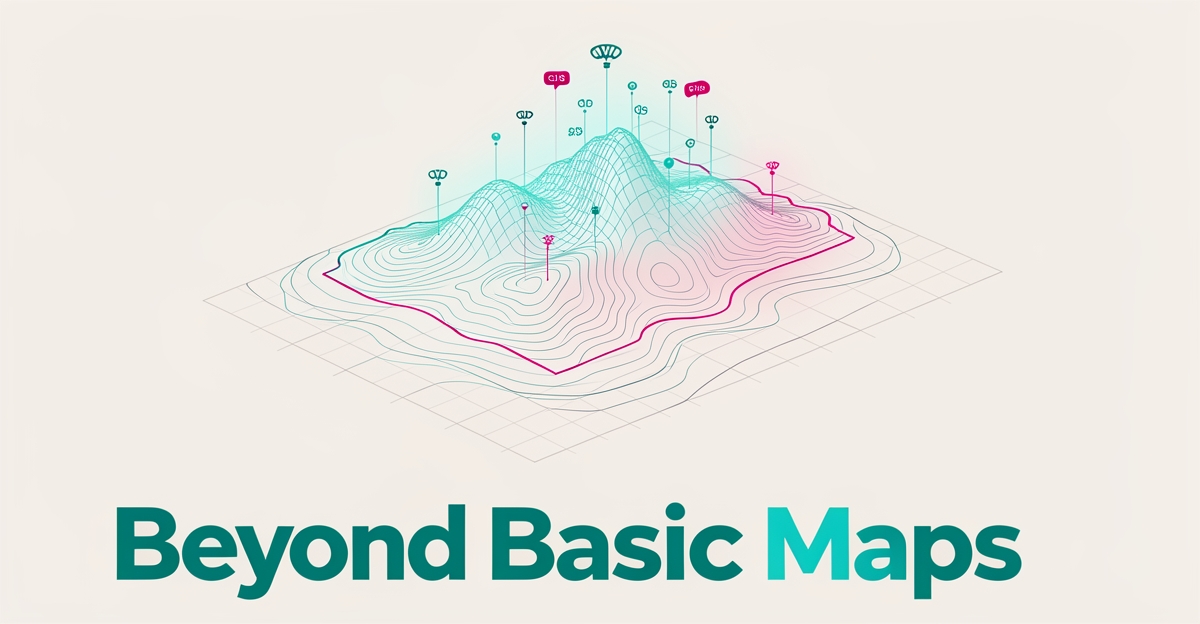
A static site map shows a boundary. It says nothing about the 3D digital twin modeling the orebody below, the IoT sensors streaming water quality in real time, or the multi-source GIS integration that guides every drill decision. Yet that is exactly what modern exploration operations run on — and what investors, regulators, and communities never see.
The disconnect is measurable. Advanced GIS platforms integrating satellite, drone, geophysical, and historical drill data have delivered 30–40% improvements in discovery rates across major gold districts, with Nevada Goldfields achieving a 30% gain in mapping accuracy and a 2.3 million ounce resource estimate source. Over 75% of new gold sites in 2025 are expected to be identified using these same technologies source. When a firm's public-facing map shows only a claim outline, it hides the very sophistication that de-risks the project.
That hidden sophistication is now a credibility liability. Nick Bell, Global Sector Lead Mining at Worley, warns the industry has not "won the hearts and minds of the public, and in some cases, investors" source. BlackRock has cautioned that investor reluctance may reduce miners' access to capital and delay the energy transition source. Social license failures in Peru and Panama cut copper production in 2023, while constitutional uncertainty in Chile raises resource nationalism risk source. The presentation gap feeds the trust deficit directly.
Specialized mapping services already create the assets that could close this gap — but they stay in the engineering department. Darling Geomatics builds precise digital twins of underground mines, infrastructure, and topography using 3D scanning and UAVs source. IoT sensors stream real-time environmental data to cloud GIS dashboards source. A peer-reviewed study mapped 65,585 km² of global mining footprint with boundaries, waste dumps, tailings dams, and processing infrastructure — detail that enables accurate impact modeling and supply chain transparency source. Nearly 10% of that footprint falls in protected areas source.
Exploration firms that keep these capabilities invisible miss the chance to prove what they already practice. The fix is not more data — it is making the data visible where prospects look first. AI Business Sites builds location pages that surface this depth automatically: interactive map layers, real-time monitoring feeds, and 3D visualizations drawn from the same GIS and IoT systems driving operations. The credibility is already there. The map just has to show it.
What Advanced GIS Mapping Proves About Exploration Competence
The gap between what exploration teams know about their projects and what prospects see on a website is measurable — and it's costing firms credibility. When investors, regulators, or community stakeholders land on a location page showing only a static claim boundary, they're not seeing the operational reality that drives discovery success.
Advanced GIS platforms prove the difference. Across three major gold districts — Nevada Goldfields, Witwatersrand Basin, and the Pilbara Region — firms integrating satellite imagery, geophysics, geochemistry, historical drill data, and IoT sensor feeds into cloud-based GIS achieved 30-40% improvement in discovery rates and up to 30% higher drilling hit rates while maintaining environmental impact scores of just 2-3 on a 10-point scale. Over 75% of new gold sites in 2025 are expected to be identified using these same technologies.
The capabilities exist. The data exists. What's missing is the translation layer.
- Multi-source satellite and drone imagery revealing structural controls
- Geophysical and geochemical anomaly overlays without exposing proprietary thresholds
- Historical drill collar locations with interpolated grade shells
- Real-time environmental monitoring feeds — water quality, air, ground stability
- Infrastructure and rehabilitation planning layers
This isn't about revealing trade secrets. It's about showing the rigor behind the resource. A location page that lets a prospect toggle between lithology, alteration zones, and environmental controls — without exposing raw assay data — signals the same technical discipline that drives those 30-40% discovery improvements. The Mongabay study mapping 65,585 km² of global mining footprint found that detailed boundary data enables "a million different things you can overlay" for impact analysis — the same principle applies to stakeholder confidence.
AI Business Sites builds this translation layer directly into location page architecture. The platform's AI content engine structures each project area as a topical cluster — geology, infrastructure, environmental, community, regulatory — with automatic internal linking that captures search traffic from every stakeholder type researching the asset. The result: location pages that demonstrate operational competence before a single meeting is scheduled.
Environmental Transparency as a Conversion Tool
Environmental Transparency as a Conversion Tool
The mining industry faces a trust deficit with investors, regulators, and communities, exacerbated by the lack of transparent environmental boundaries and operational practices. A groundbreaking study by Mongabay revealed that nearly 10% of global mining areas (6,232 km²) fall within protected zones, highlighting the urgent need for environmental transparency source. Prospects now demand visible proof of environmental responsibility, including water management infrastructure, tailings facilities, and rehabilitation plans, to mitigate the risks associated with mining in sensitive ecosystems.
Mineral exploration firms can leverage this demand by embedding compliance visualization directly into their location pages. Instead of burying critical environmental data in technical reports, firms can showcase interactive, multi-layer GIS maps that toggle between geology, infrastructure, and environmental controls. For example, Nevada Goldfields achieved a 30% improvement in mapping accuracy and a 2,300,000 oz gold resource estimate by integrating satellite, drone, and historical drill data into their GIS platform source. This not only addresses ESG scrutiny from investors and regulators but also differentiates firms practicing audit-ready transparency.
Key Transparency Strategies for Conversion:
- Embed Interactive GIS Maps: Showcase environmental boundaries, water management, and rehabilitation plans directly on location pages.
- Real-Time Data Feeds: Expose key environmental and operational metrics (e.g., water quality, air monitoring) to build trust.
- 3D Digital Twin Visualizations: Repurpose engineering assets into stakeholder-facing stories highlighting safety and technical rigor.
By integrating these strategies, mineral exploration firms can transform environmental transparency into a potent conversion tool, appealing to the growing demand for ESG integrity and technical sophistication. As highlighted by Worley's Global Sector Lead Mining, Nick Bell, "winning the hearts and minds of the public and investors" is crucial, and transparent, data-driven location pages are a critical step in this direction source. AI Business Sites' dynamic, interactive maps and location-based content can help firms achieve this, enhancing their online presence and credibility.
Local business: doing this the old way?
One system replaces the whole pile.
All of it — the website, the follow-up, the content, the leads — built and run for you for $1,497 + $497/mo. Month-to-month, and you own everything.
See what your build includesRepurposing Engineering Assets for Stakeholder Conversion
Mining firms already possess the visual assets that win stakeholder confidence — they just live in engineering silos. Specialized survey firms create precise digital twins of underground mines, surface infrastructure, and topography using 3D scanning and UAVs, capturing every shaft, tunnel, and fixed asset for structural assessments and logistics planning. Darling Geomatics deploys fixed-wing UAVs, quadcopters, and laser tracking to build these models while keeping personnel out of hazardous zones entirely. Meanwhile, cloud GIS platforms ingest real-time IoT feeds from environmental sensors, streaming water quality, air monitoring, and ground stability data into operational dashboards. These are not presentation tools — they are the daily decision engines running modern exploration.
- 3D deposit models with layer-toggling geology, structure, and drill intercepts
- Interactive infrastructure maps showing processing facilities, tailings, and water systems
- Live environmental feeds displaying compliance metrics in real time
- Underground as-builts revealing deposit geometry and safety systems
The gap is not technical capability — it's translation. Advanced GIS platforms integrating satellite, drone, geophysical, and historical drill data have delivered up to 40% improvement in discovery rates across major mining regions, yet the same multi-layer intelligence rarely reaches public-facing location pages. Global footprint mapping of 65,585 km² reveals nearly 10% of mining areas intersect protected zones, making visible environmental boundaries a credibility requirement, not a nice-to-have. When investors and regulators encounter static PDF maps instead of interactive visualizations showing real-time compliance, deposit geometry, and infrastructure context, the technical rigor behind the project stays invisible.
Safety-focused remote surveying and cloud GIS dashboards with IoT feeds already produce the data streams that prove operational discipline. Repurposing these assets into web-accessible visual stories — where a prospect can toggle geology layers, inspect 3D underground models, and see live water quality readings — converts engineering deliverables into conversion tools. The AI Business Sites platform automates this transformation, turning technical survey outputs into dynamic, location-based content that demonstrates the data richness stakeholders demand before they commit.
Building Location Page Clusters That Capture and Convert Search Traffic
Building Location Page Clusters That Capture and Convert Search Traffic
Mineral exploration firms often miss crucial leads due to basic site maps that fail to convey the complexity and sophistication of their projects. By transforming static maps into dynamic, topical clusters, firms can capture targeted search traffic and build topical authority rewarded by Google.
The Power of Topical Clustering
A study by Mongabay highlights the value of detailed, structured location data, enabling "a million different things you can overlay" for analysis (Mongabay, 2023). By organizing project areas into topical clusters (e.g., geology, infrastructure, environmental controls, community engagement, regulatory status), exploration firms can mirror this approach. Each cluster becomes a hub of detailed, interconnected content, automatically linked to enhance user experience and search engine understanding.
Practical Implementation
- Geology Layer: Interactive maps showcasing lithology, structural geology, and geochemical data.
- Infrastructure Layer: Visualizations of site layout, including roads, facilities, and equipment.
- Environmental Controls: Transparent display of water management, tailings facilities, and rehabilitation plans, highlighting low environmental impact scores (e.g., 2-3/10 as seen in successful GIS applications Farmonaut, n.d.).
- Community Engagement: Stories and metrics on local partnerships and social initiatives.
- Regulatory Status: Up-to-date permitting information and compliance documentation.
Capturing Search Traffic
- Investors: Searching for "mining projects with strong environmental compliance" are directed to the environmental controls layer.
- Regulators: Queries like "regulatory status of [Project Name]" lead to the transparently updated regulatory cluster.
- Communities: Searches for "local impact of [Mine Name]" result in the community engagement section.
AI Business Sites Solution
AI Business Sites' platform automatically generates dynamic, interactive maps and location-based content tailored to each region’s geology, streamlining the creation of these topical clusters. With its built-in SEO optimization and internal linking capabilities, the platform ensures that each project area becomes a discoverable, credible resource, capturing and converting targeted search traffic effectively.
Conversion Through Transparency
By embracing this structured approach, mineral exploration firms not only improve their online visibility but also address the industry's trust deficit highlighted by Worley. Advanced GIS mapping, already proven to enhance discovery rates by 30-40% Farmonaut, n.d., is transformed into a marketing asset, converting prospects into engaged stakeholders.
Key Statistics Driving the Approach
- 30-40% improvement in discovery rates and mapping accuracy with advanced GIS Farmonaut, n.d..
- Nearly 10% of global mining areas are in protected zones, necessitating transparent environmental visualization Mongabay, 2023.
- 75% of new gold sites in 2025 expected to leverage advanced GIS technologies Farmonaut, n.d..
Frequently Asked Questions
Why do basic site maps hurt our credibility with investors and regulators?
What specific mapping capabilities should we show on our location pages to prove technical competence?
How does environmental transparency on our website actually convert prospects?
We already have 3D digital twins and IoT dashboards from our engineering team — why aren't they helping us win stakeholders?
Can better location pages actually capture more search traffic from investors and regulators?
Is it risky to show this much operational detail publicly — won't we expose trade secrets?
Beyond the Boundary: Unlocking Prospect Trust with Transparent Mining Maps
Mineral exploration firms face a stark reality: basic site maps are failing to convert prospects due to a glaring credibility gap. Advanced GIS mapping, which drives 30-40% improvements in discovery rates and 30% gains in mapping accuracy source, remains hidden from public view. Meanwhile, nearly 10% of global mining areas lie within protected zones, necessitating transparent environmental visualization source. To bridge this trust deficit, firms must transition from static PDFs to interactive, multi-layer GIS presentations on their location pages, embedding real-time environmental data feeds and repurposing 3D digital twins for stakeholder engagement. By doing so, they not only enhance technical credibility but also address the industry's broader trust and capital access challenges highlighted by leaders like Nick Bell at Worley. Next Step: Audit your location pages for transparency and data richness. Consider integrating dynamic mapping tools to unlock the hidden value of your operational sophistication and attract informed, engaged prospects.
FOR local businesss — BUILT AND RUN BY US
Your website. Your content. Your leads. Your data.
$500 starts your build. Seven days later it's live — chat, booking, follow-up, and your Google presence all set up. Then we run it, every month. You do the work you actually get paid for.